The Dashboard page is the analytics part of the YayPay system. It provides an actionable overview of AR for your company. In this article, we will go through the Dashboard components one by one and describe how they work.
Header
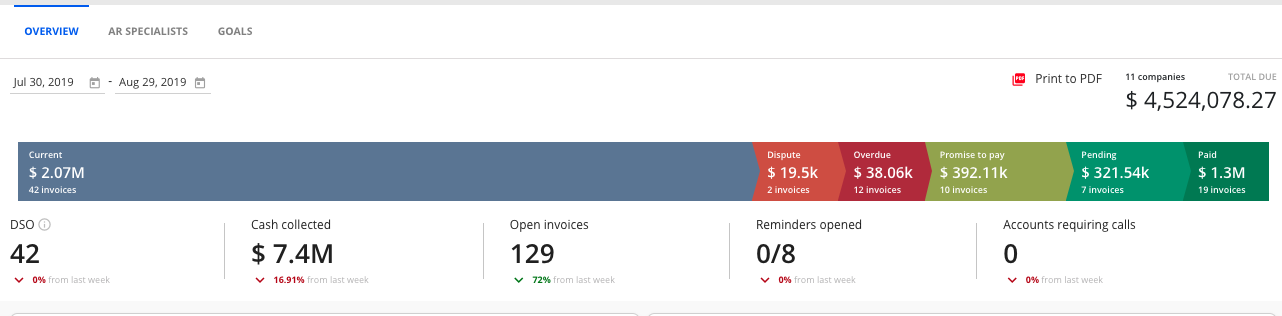
On top of the page, you can find general statistics on your accounts receivable.
It starts with a date picker component that allows you to select the date range for the data displayed.
Total Due
Not affected by the date picker
The TOTAL DUE figure displayed at the top-right of the Dashboard page represents the overall AR balance for all customers/companies with non-zero balances synced from your ERP. The number of companies with non-zero balance is displayed above this figure.
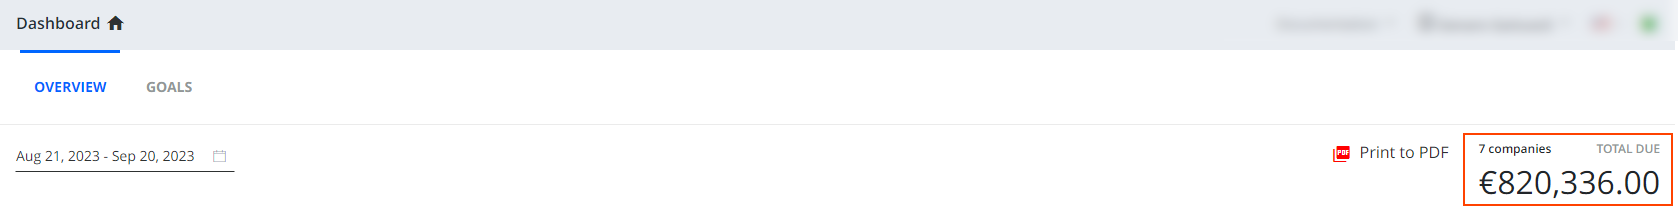
The TOTAL DUE shows current data regardless of the date range selected in the date picker on the left. If you want to compare customer balances with your ERP, you can use the Aging Report page.That page also shows AR balances for each customer/company.
AR Pipeline
Partially affected by the date picker
This component provides a visual representation of your current AR state for the day. It is a snapshot.

The pipeline only takes into account open invoices, i.e. unpaid and partially paid invoices that have non-zero balances. It does not take into account any of the other kinds of documents such as adjustments.
The pipeline consists of the following parts:
- Current – shows how much AR you have in your open invoices that are current, not disputed, and don't have any Promissory Note or a Pending Payment associated with them.
- Dispute – shows the total amount of all the open invoices that have an open dispute.
- Overdue – shows the total amount of open invoices that are overdue, regardless of their age.
- Promise To Pay – shows the total of open invoices that have a Promise to pay associated with them.
-
Pending – shows the total of all the open invoices with Pending payment associated with them.
Payments become pending when they are paid via the YayPay platform, but the fund transfer is not yet confirmed. - Paid – shows the total amount of paid invoices for the selected period of time.
To see invoices that belong to a specific category, hover your mouse pointer over the relevant, colored component and click the View button that appears.
This will show a list of invoices with a selected status and their details:
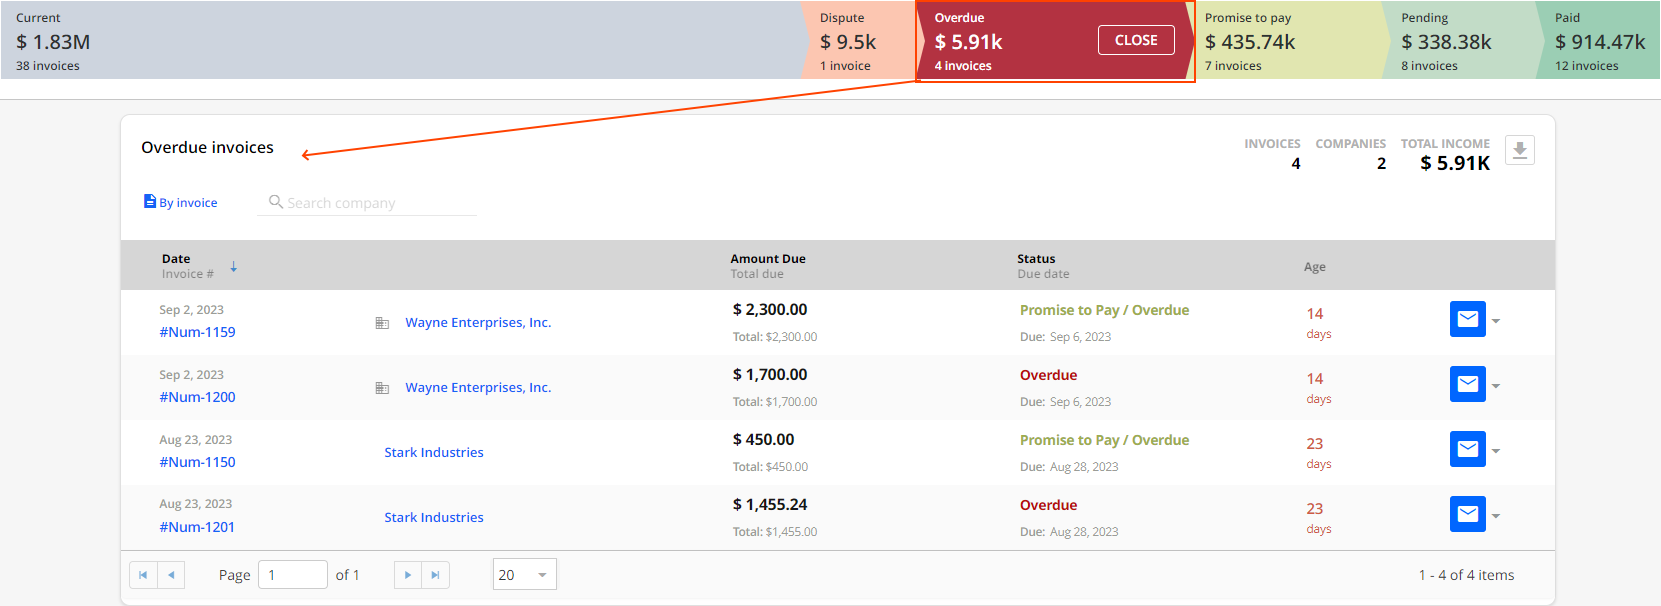
This view provides you with a possibility to: perform various actions on invoices; download the list of displayed invoices; access a customer's individual Statement page by clicking on their name; or view a specific invoice by clicking on its invoice number.
Rounding Values
In YayPay, values that meet certain thresholds are rounded and displayed using specific abbreviations:
- Values greater than or equal to 1 billion are rounded and displayed as "G".
- Values greater than or equal to 1 million are rounded and displayed as "M".
- Values greater than or equal to 1 thousand are rounded and displayed as "K".
For example, a value of 1,500,000 would be rounded and displayed as "1.5M".
DSO
To get a clearer picture of how long it typically takes for your company to receive payments from customers, you can utilize the days sales outstanding (DSO) metric. This metric provides insights into the average time it takes to collect payments.
This is a static Days Sales Outstanding value, calculated for the previous day using a standard formula:
DSO = 365 * Current AR / Net Credit Sales
As you can see, the value is calculated based on the rolling last year data using the following data:
- Current AR - your current accounts receivable balance.
- Net Credit Sales - calculated as a total of all of the invoices for the last 365 days minus all the Credit memos that were allocated to those invoices.
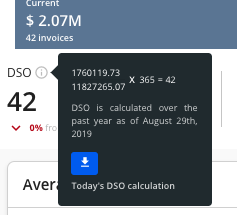
If you want to see how exactly the value is calculated for your specific business, you can download a DSO report by clicking the blue download button.
Additionally, you can find the customer's DSO value on these pages:
- Statement – Displayed in the header.
-
Aging Report and Invoices – You can add the DSO column to the grid to display the customer's DSO value.
When you add the DSO column to the grid and export the data to an Excel file by clicking on the Export to Excel button, the DSO column will be included in the exported file.
Cash Collected
This component displays the total amount of payments received at the specified period of time.
Cash Collected Trend calculation shows you how you are doing in comparison to the last full calendar week.
Open Invoices
Shows the number of invoices that were open at the end of the selected period of time. The open invoices trend compares this number to the number of the last calendar week.
Reminders Opened
This component shows you the total number of emails that were sent from the system for the selected period of time (including both manual and automated emails), and how many of them were opened.
Numerator shows you the number of opened emails, and Denominator shows the total number of them.
Trend number indicates how the total number of sent emails looks like in comparison to the last calendar week.
Accounts Requiring Calls
This component shows the number of unique customers that have Call tasks automatically created from workflows with a due date within a specified time range, i.e tasks with the Schedule a call Action set.
You can also access this information by filtering the Tasks page by Type: Calls.
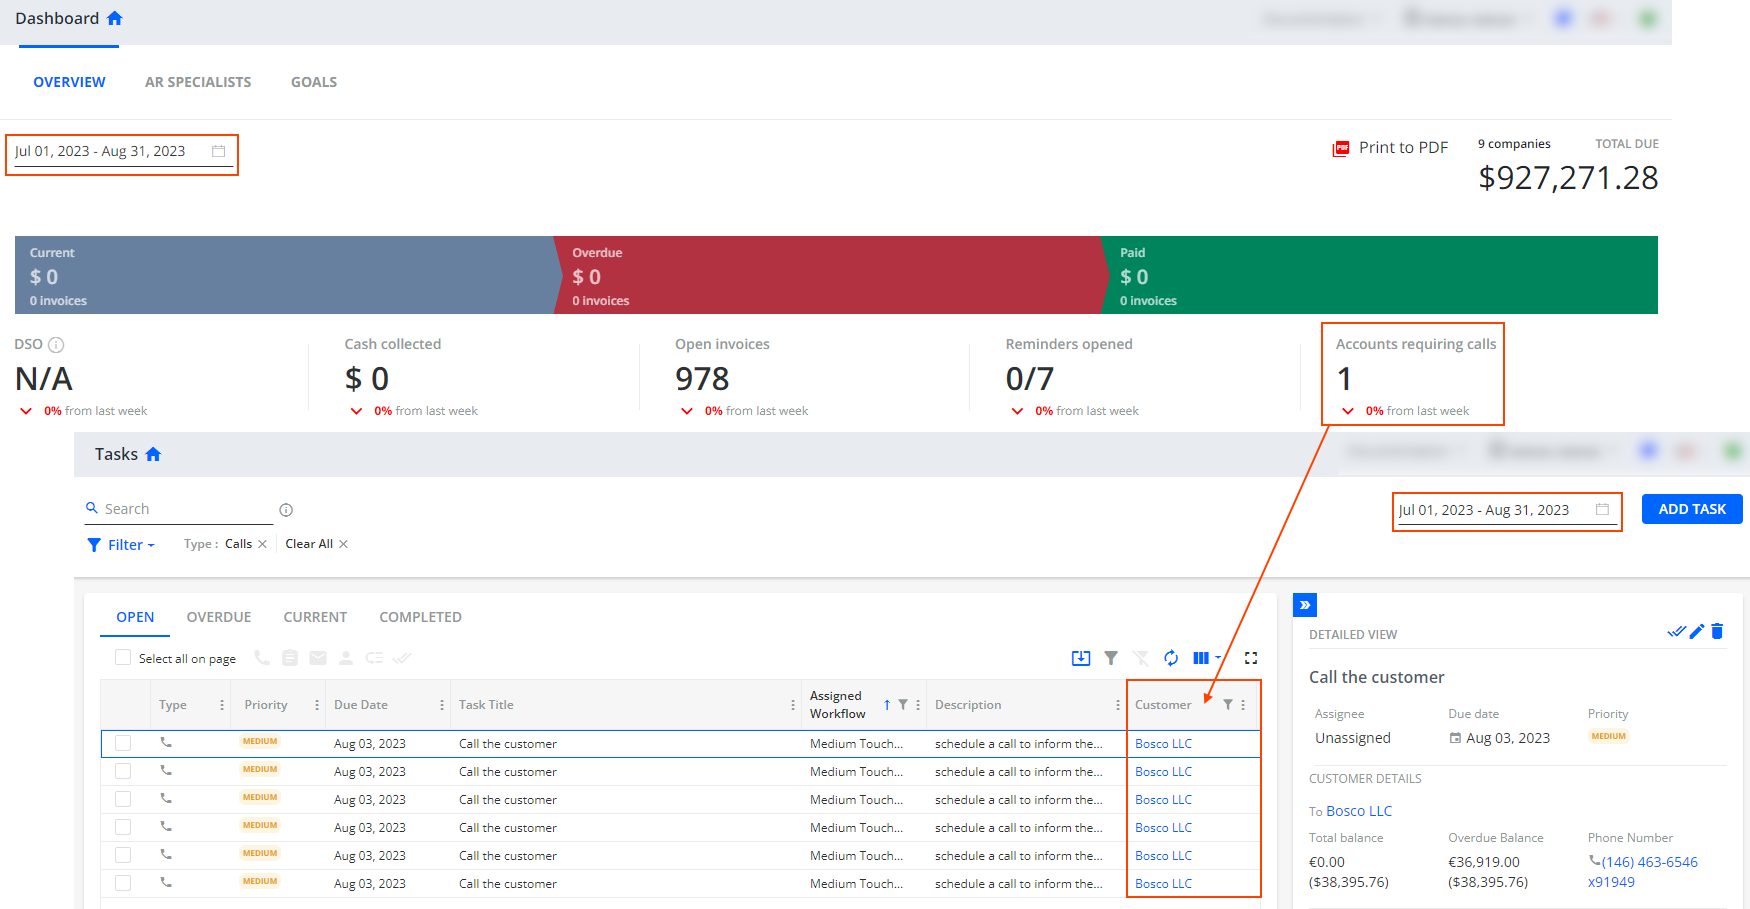
The trend line compares the current value to the previous value from the last full calendar week.
Average Days To Pay
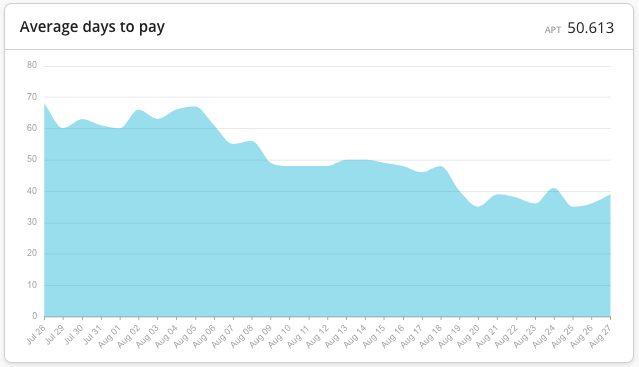
Average payment time (APT) or Average Days To Pay is a metric, similar to DSO, which simply looks at the average value on how many days it takes to pay an invoice.
This chart shows the dynamics of the APT in time. Each value is calculated as a rolling 3-month average of the days to pay for all invoices that were paid in full during this period of time.
By default, Days to Pay for an invoice is calculated as a difference in days between the invoice creation date and the creation date of the last payment (or a credit memo) that paid this invoice.
There's a setting in the Business Settings that can change this calculation and make it calculate the difference between the Due Date and last payment date. To enable it, go to Settings -> Business and select 'Dashboard - Calculate APT based on invoice due date'.
Top Paying Customers
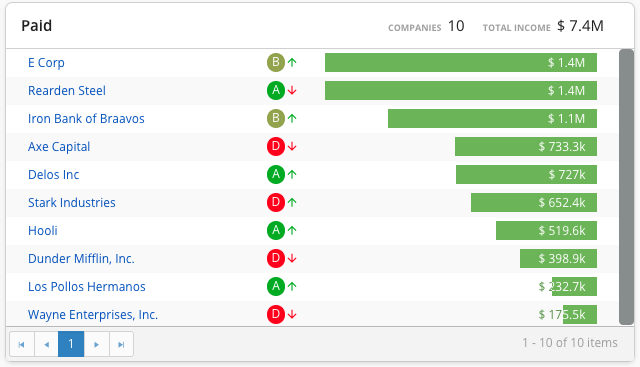
This chart displays your top paying customers for the selected period of time. The total amount of payments from a customer consists of both allocated and unallocated payments (and not Journal Entries, Debit Memos, or other kinds of documents).
Total Income and Companies fields will depend on the selected date range and represent the companies that sent you payments during the selected period.
The indicators A, B, C, and D denote the promptness of a customer's payment - “A” means that a customer pays "quickly", while “D” means that a customer is slower to pay.
The Up and Down arrows show whether a customer paid quicker or slower than the previous quarter’s average.
A – If the oldest invoice was paid within 15 days after the due date
B – If the oldest invoice was paid within 16–60 days after the due date
C – If the oldest invoice was paid within 60–90 days after the due date
D – If the oldest invoice was paid more than 90 days after the due date
Open Invoices Chart
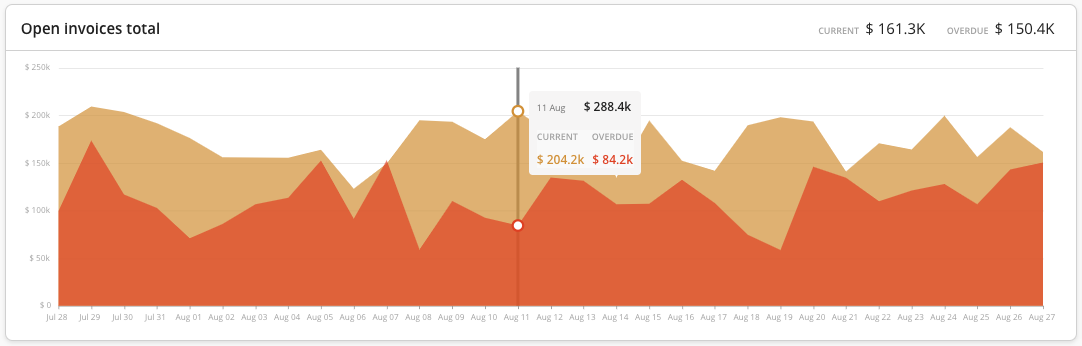
This chart demonstrates the dynamics of the number and amount of open invoices over time, splitting them into current and overdue invoices.
The chart only shows the data for the selected period of time. If you hover over the chart, you will see a popup indicating the total amounts of open and overdue invoices for a selected date.
Current and Overdue fields show you the totals of appropriate kinds of invoices for the later end of the selected date range.
Email Reminders
Not affected by the date picker
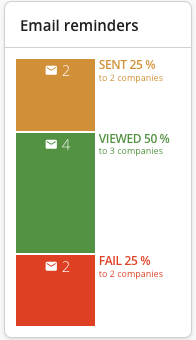
This component shows the number of emails sent to the customers (both manual and automated) that were sent through YayPay from the creation of this account. Note, it does not include internal email statistics.
Sent - shows all the emails with the status Sent (which means they are not Viewed and not Failed).
Viewed - number of emails with Viewed status, meaning they were opened by a recipient.
Fail - all the emails that were failed to be sent or bounced back from the recipient email address.
This component is clickable and will bring you to the communication page with the appropriate filter turned on.
Cash Collected
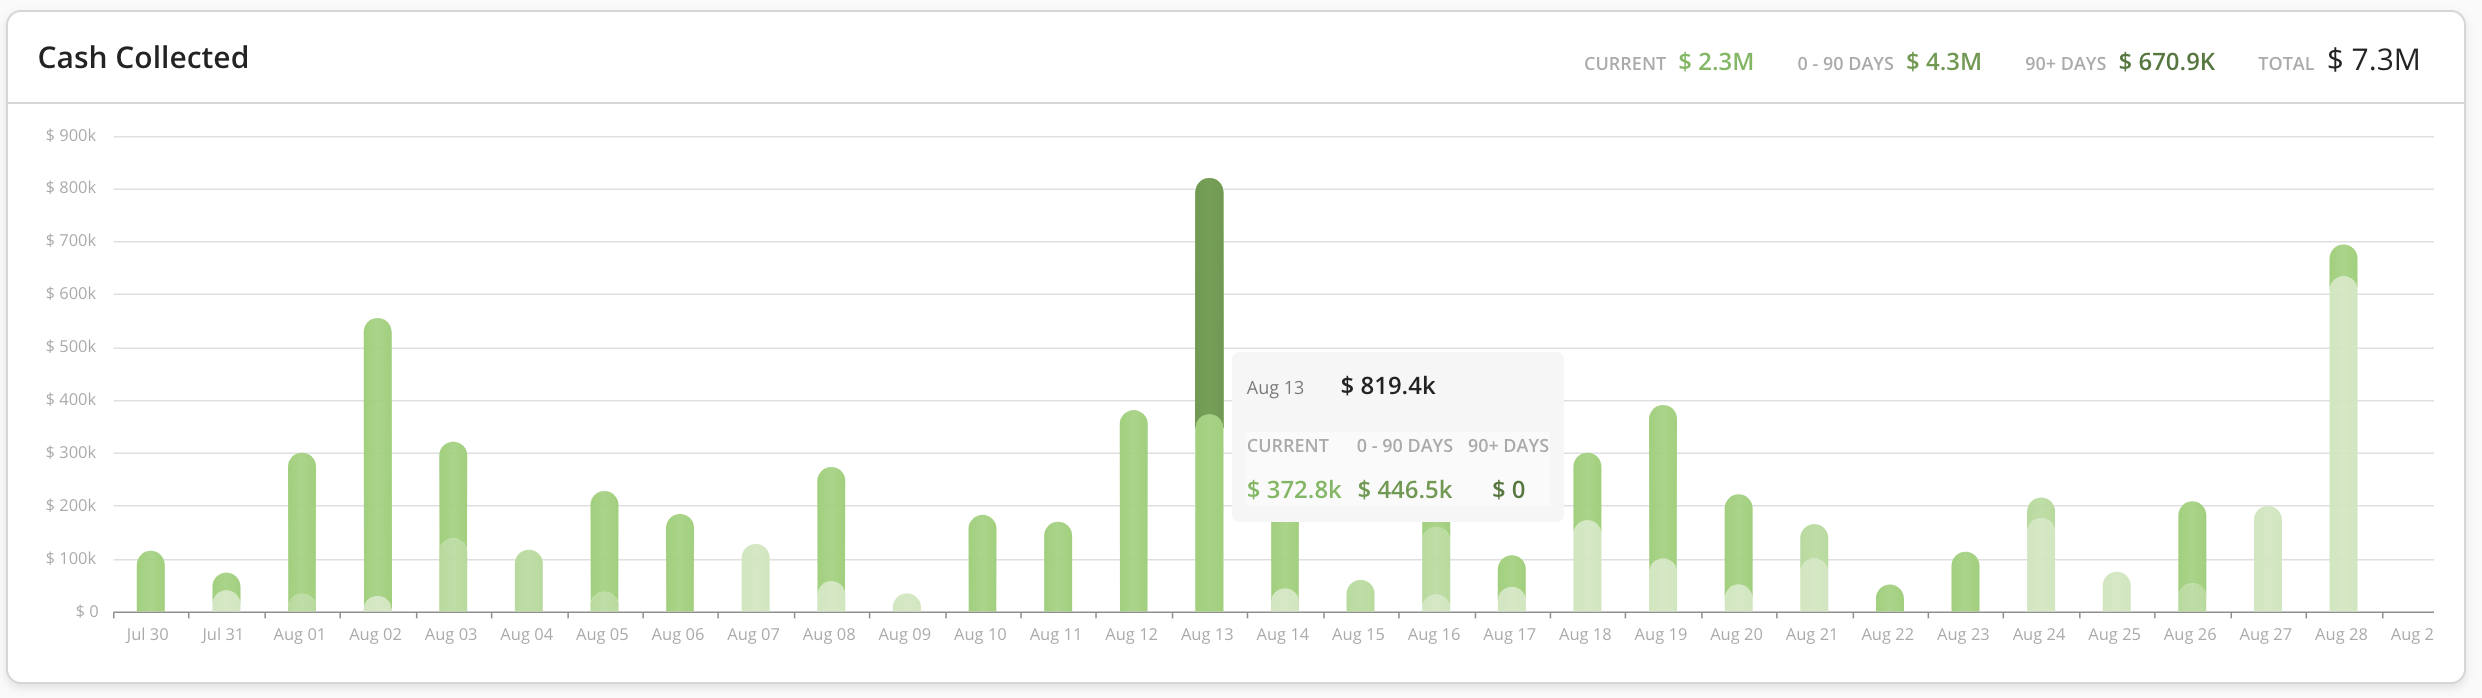
This chart demonstrates the total amount of payments received every day in the selected date period. The payments are color-coded and split onto the Current, 0-90, and 90+ payments depending on which invoice this payment is applied to.
Summary Values on top of the chart display total amounts of payments in different buckets for the selected period of time.
If payments are received in foreign currency, they are translated to the home currency using the payment exchange rate, set in the ERP on this payment record.
Payment Projections
Payment projections charts are described in detail in the Payment Projections & Cash Forecasting article.
AR Specialists
See Dashboard - AR Specialists article for more details.
Collection Goals
See Dashboard - Goals article for more details.
