In order to get an idea of how Reporting module works, sample reports have been provided for you.

To see how sample reports work with your data, use the SAVE AS functionality: save the chosen sample report under some different title, configure the settings, and start working: add columns, sort/filter the data, add charts, etc.
On this page, you will get an overview of YayPay sample reports and their prospective value for your business purposes:
See also:
Video Tutorials:
- BI Module General Overview: [Video Tutorial] BI Module Overview
- How to create reports: [Video Tutorial] Report Creation
- How to add charts and visuals to your reports: [Video Tutorial] Charts
- How to use formulas in the reports: [Video Tutorial] Formulas
Related articles:
- How to create your own report, edit and manage the existing reports (scheduling, downloading, restricting access to reports): Creating and Managing Reports
- Which data is incorporated in data sources and how to handle it: Reporting Section Sources
- How to set up reports filters and presets and incorporate charts: Reports Filters and Charts
- What are dashboards and how they are configured: Dashboards in Reporting
- How to use formulas in your reports: Formulas in Reporting
AR Specialist Snapshot (data source: AR Specialist (Historical))
"AR" Specialist Snapshot" can provide an insight into the productivity of the team including activity on the platform such as calls, disputes, notes, promises to pay, etc. Helps to monitor the productivity of disparate teams, especially with remote work or global teams. It will be helpful in assessing bandwidth or portfolio management. As a manager, you can understand workload, cost containment, and productivity.

Adjustments (data source: Adjustment)
The "Adjustment" report becomes useful for tracking payment adjustment details and their amounts.

Calls (data source: Call Log)
"Calls" report is mainly used to track calls. It helps to provide insight into team productivity especially if outbound call volume is a KPI.
Contacts List (data source: Contacts)
"Contacts List" report incorporates all contact data. It gives you the ability to download all contact info and update as needed. This can be a useful addition to the excel mapping tools for mass updates.

Credits (data source: Payments/Credits)
The "Credits" report provides insight into the credits issued by a company by reason. This can identify areas in the business that may require review/change.

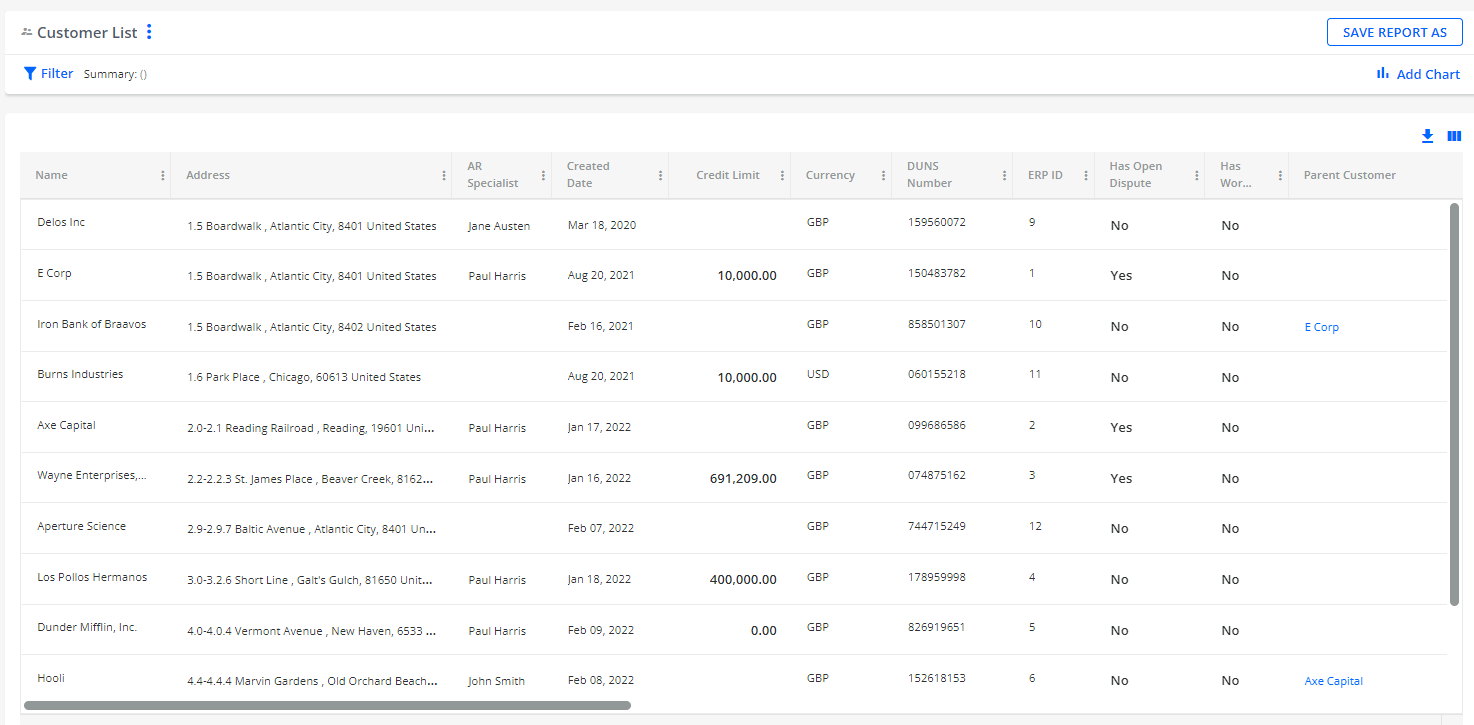
Customer List (data source: Customer)
This kind of report can be used to provide insight into any area of the customer.

Customer Snapshot (data source: Customer (Historical))
"Customer Snapshot" report helps to provide insight into customer volume and trends. It appears to be especially useful for businesses with multiple instances or product lines to determine growth. It can also help in determining headcount, portfolio distribution of accounts, etc. Also, a great option is to save daily aging so that you can look back at any point in time and see where things stood.

Disputes (data source: Dispute)
"Disputes" report becomes useful for tracking disputes, volumes, reason codes, resolution, and where they lie within a business or process. Will typically be used to identify areas within the business process that are failing and resulting in disputes or short payments. This can then be leveraged to correct or improve the process and eliminate delayed or missed payment.

Emails (data source: Email)
"Emails" report is convenient to track the statuses of the emails, whether they have been viewed or not, as well as other details to be viewed in one grid and exported to Excel if needed.

Invoices (data source: Invoice)
You may use the "Invoices" report to track invoicing trends over time to predict future revenue expectations (seasonality, contract timing, etc.) It can confirm an increase or decrease in sales. Helps justify the need for increases or decreases in resources.

Payments (data source: Payments/Credits)
The "Payments" report is helpful for showing a historical view of customers' payments as well as identifying trends in payment behavior. By using this report you can see which of your customers are paying use which method. This can be helpful if you are trying to push customers to use ACH or CC instead of paper checks. It can also help with cash forecasting as you can see over time when you get the majority of your payments (particularly if you invoice monthly and have net 30 terms etc.) Can also be used to track unallocated payments and hopefully reduce them.

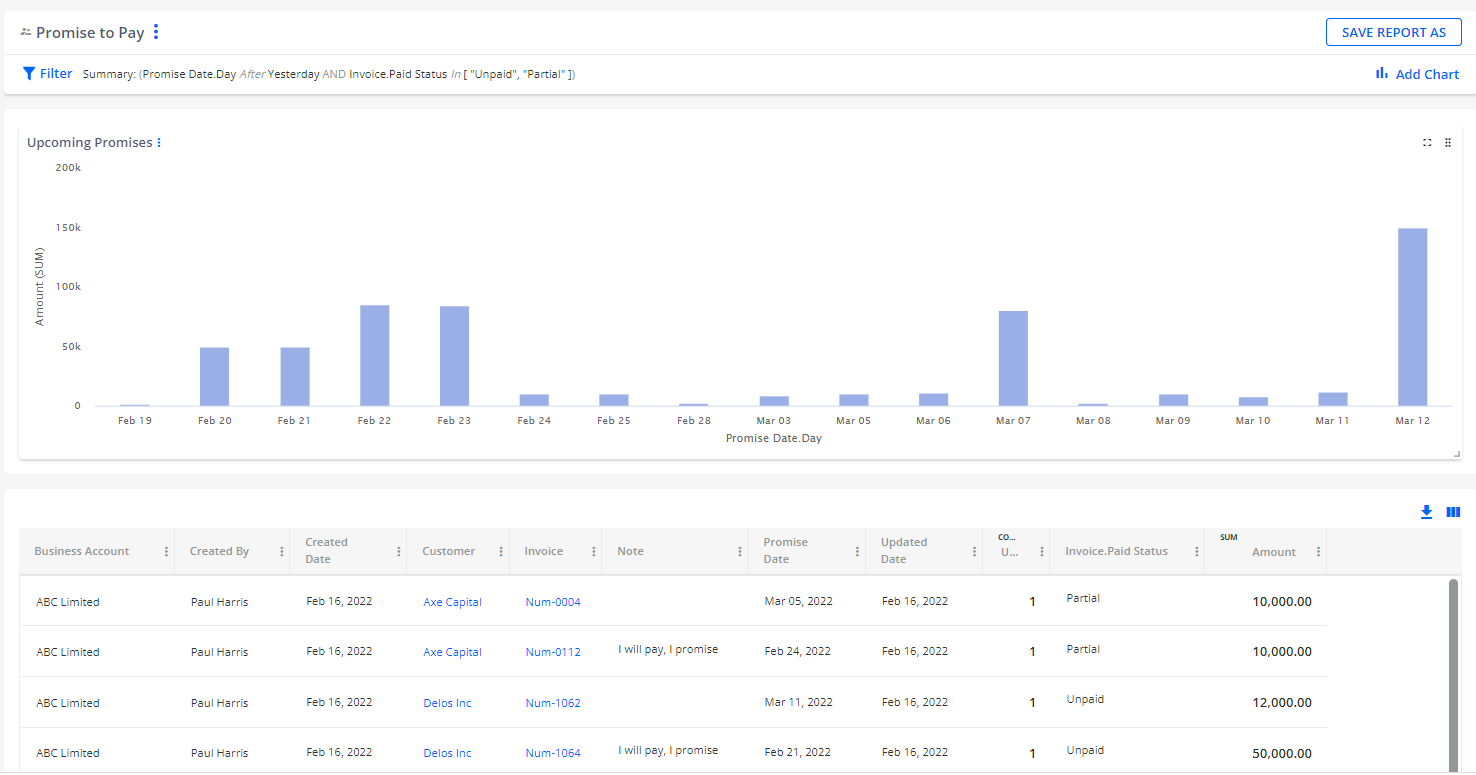
Promise to Pay (data source: Promise To Pay)
This kind of report is helpful in cash forecasting.

Tasks (data source: Tasks)
The "Tasks" report helps to measure workload and productivity of the team and assists in identifying areas of the business that might need adjustment.

Transactions (data source: Open Transaction)
The "Transactions" report assists in tracking the transactions and their details by the customer.

User Activity (data source: User Activity)
"User Activity" report helps to measure the workload and productivity of your instance users and helps identify areas of the business that might need adjustment.

